Poker Table Selection: How to Choose the Most Profitable Table
Almost as important as selecting the most suitable online poker room is choosing the right poker table to play at. The potential outcomes at each table can vary significantly, so how can you improve your chances of making the most of your new strategy?
Well no, there is a logic behind it and in this lesson we are going to look at how to select the most profitable cash game table from the lobby.
What are we Looking for?
We’re looking for tables with players who frequently play many hands and tend to chase unlikely outcomes, hoping to hit cards on the flop, turn or river to make their hand irrespective of how unlikely it is to happen (commonly referred to in poker slang as ‘fish). These players are less selective and may offer opportunities for careful, strategic play.
Now in a live casino the only way to do this would be to stand and observe the tables and spot the one with the players who are chasing.
Luckily with online poker this guesswork and time consuming observation is taken away from us, as we are given table statistics in the lobby for each and every table, which is extremely helpful seeing as there can be hundreds of tables to choose from.
So How do we Choose the Most Profitable Table?
The first step is to ensure that you are looking at the right tables. In the first stage of this course and the Poker Bankroll Challenge you will be playing at the 5cent / 10cent stake level and throughout this course you will be focused on the No Limit Texas Holdem ring (cash) game tables.
So, from the lobby, make sure you are looking at the ring game tables, and click on the Holdem tab and select the No Limit button just underneath. For this course, we recommend starting at lower stakes, such as 5c/10c, with full tables of 9 or 10 players. Avoid short-handed (6 player) tables for now as you build your skills.
As you look at the tables available you will see a number of statistics here, let’s have a quick look at what they mean:
- Players – The number of players sat at the table and the maximum players, eg: “7/9” = 7 players sat down with 2 spare seats.
- Stakes – The size of the small blind and big blind and subsequent bets, eg: “5c/10c” = small blind is 5 cents ($0.05) and the big blind is 10 cents ($0.10).
- Limit – The type of Poker Betting Limit of the game being played, either No Limit, Pot Limit or Limit (Fixed) – eg: “NL” = No Limit
- Type – Poker room specific which will show icons for the type of game it is, for example there might be an icon for webcam poker tables, usually there is a legend explaining the icons at the bottom of the lobby.
- Average Pot – Self explanatory, keeps track of all the winning pot values and provides an average pot size as a statistic for the table.
- Players / Flop – The average number of players who see the flop, ie: the players that are not folding before the flop and at least call the pre flop bet and see the cards on the flop, eg: “45%” = at a full 9 man table this would indicate that on average 4 players (9 x 45%) see each flop, meaning there is at least 4 big blinds in most pots.
- Hands / Hour – This is an indication of the speed of the table and displays the average number of hands that are dealt in each hour, the higher the number the faster the table is acting and getting through more hands per hour.
- Wait – If a table is full then you can sign up for the waiting list for that table, as a player leaves, that seat is offered to the next person on the waiting list. This statistic shows you how many people are currently on the Waiting List.
Players per Flop
The statistic we are interested in to start with is the % of players seeing the Flop, or the Players per Flop column. What this number is telling us is the average % of the players at the table who see each flop. Our basic rule of thumb here is that the higher this number is, then the more inexperienced players the table contains.
Why? Because as you have already learnt, inexperienced players chase bad cards, they play hands that they should just fold, and hence you get more players trying to play each flop without any kind of proper hand selection.
A table with a lower percentage would indicate better players, so if you saw a table with 5% then this table has a lot of better players, who play hands selectively before the flop and don’t play with hands they shouldn’t.
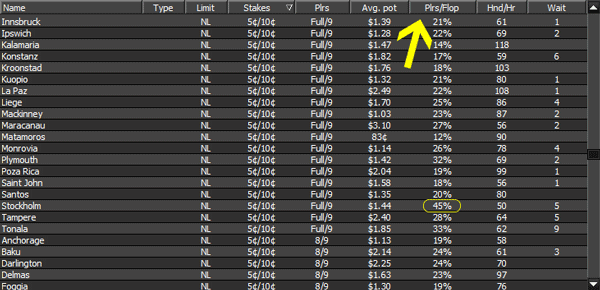
As you can see from the screenshot above, there is one table that stands out above the others in the list with a 45% players/flop statistic – this is a really really good table to sit down at, and I would be getting my name on that table’s waiting list as soon as possible.
What we are looking for is tables with a Plrs/Flop % higher than 20%. If you can find tables with greater than 30%, that is even better. The higher the percentage, the more likely the table contains players who are less selective in their hand choices, which can create profitable opportunities for disciplined, strategic play.
As you can see in the screenshot above, it’s showing many tables with a Plrs/Flop % above 20%, and some over 30%, including one table with a notably high 45% figure.